The price of bitcoin remains overvalued and although demand has increased in the last two weeks, it is not enough to justify prices around USD 65,000, says analyst Willy Woo. The price of BTC is consolidating below the highs of last week, with strong support at USD $ 55,000, says the analyst.
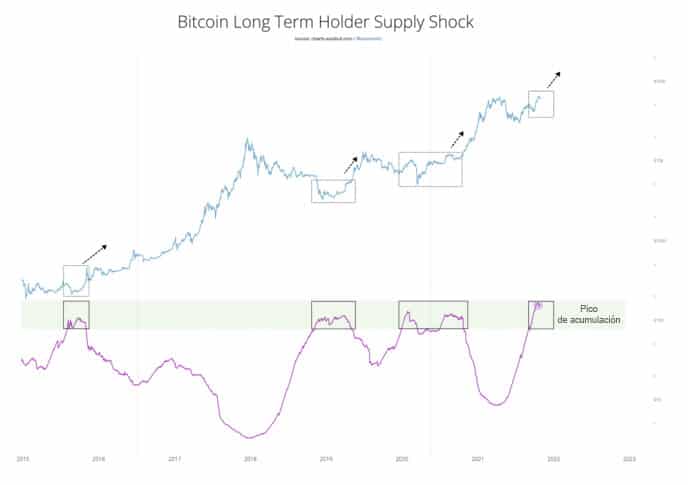
In the long term, the supply shock it is strengthening at the highest levels of accumulation by long-term holders, Woo reiterates. He cautions, however, that it remains to be seen how long this parameter will remain at maximum levels, says the analyst in his most recent bulletin on the bitcoin market.
“Typically, this metric starts to decline once a strong rally takes place, and long-term holders start selling. From this point of view, the bullish structure is still in an early stage. This promises a bull market well into 2022 », the analysis points out.
As can be seen in the following graph, the shock of the supply of the holders of Long-term is in a zone of maximum values. When these maximums occur, as can be seen in the graph, there is usually a minimum in the price of bitcoin and later a occurs bullish rally .
The behavior of demand for Long-term holders suggest a bullish rally. Source: charts.wobull.com
Short-term investors: less demand for BTC
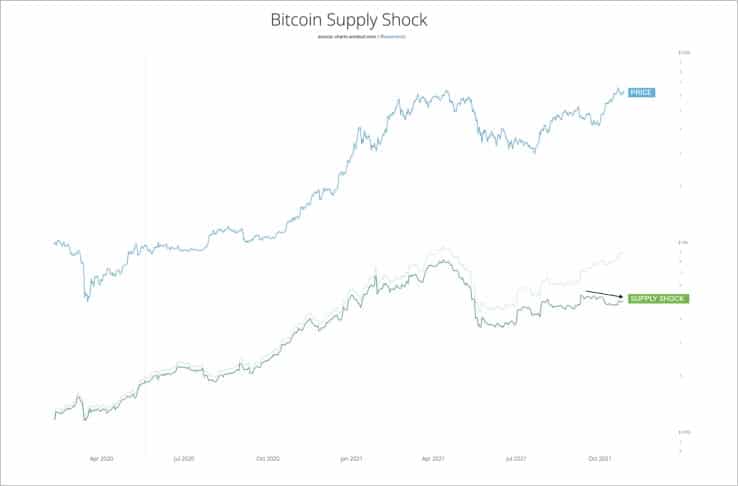
Short-term holders have had less participation in the rally that brought bitcoin to its recent all-time high, the analysis states. The supply shock for these holders is not growing, Woo notes.
The analysis highlights a slightly bearish trend for short-term holders. Source: charts.wobull.com
This metric, which is associated with less availability of BTC in the market, has grown moderately in the last weeks. But in recent days, with regard to short-term holders, a slight drop is noted and the author highlights it on the graph.
Using the Oscillator of the Supply Shock metric, evidence of price entry into an oversold region, as shown in the following graph.
The pink circle indicates that the price of BTC is above what corresponds to your demand. Source: charts.wobull.com
Woo observes that the price is returning from high oversold levels to values more consistent with the demand for The investors.
Meanwhile, as the price cools down, the flows of the spot exchanges (in the graph below) show us that the last 2 weeks have seen new Investor demand with the departure of BTC from exchanges and USDC inflows. This is a classic shopping pattern.
Willy Woo, on-chain data analyst.
Outgoing BTC flows from exchanges coincide with incoming USDC flows. Source: charts.wobull.com
In the last two weeks there has been new demand from investors, as the BTC inventories of the Exchanges decline, Woo clarifies. However, it is a moderate demand compared to the one observed before the historical maximum of October 20.
In a tweet of October 27, the analyst draws attention to an appreciation of more than 100% of the price of BTC in three months, from the low of USD 29,000, on July 20. Even so, it considers that “we are not overheated, just warm.”
The analysis highlights that, as there is insufficient demand, the price action could be Unstable with a downtrend. Clarifies, however, that the fundamentals of the chain indicate support at $ 55,000. In the long term, the trend continues to be upward due to the accumulation maintained by long-term holders.
Sandra is the Reporter working for World Weekly News. She loves to learn about the latest news from all around the world and share it with our readers.